Particle Size Analysis
Particle Size Analysis following the recognised NMBAQC process (Dry Sieve only, Laser only and Dry & Laser) comes as standard in ABACUS. ABACUS is designed to be as flexible as possible and so if there are variations to these common analysis techniques that your organisation uses we are confident that we can find a solution.
This showcase page presents features from the NMBAQC Dry Sieve Only and also includes a video of a full beginning to end analysis of Laser Only analysis sample. Click here to watch it.
Record weights of empty sieves once
LICENSE NOT FOUND OR INVALID
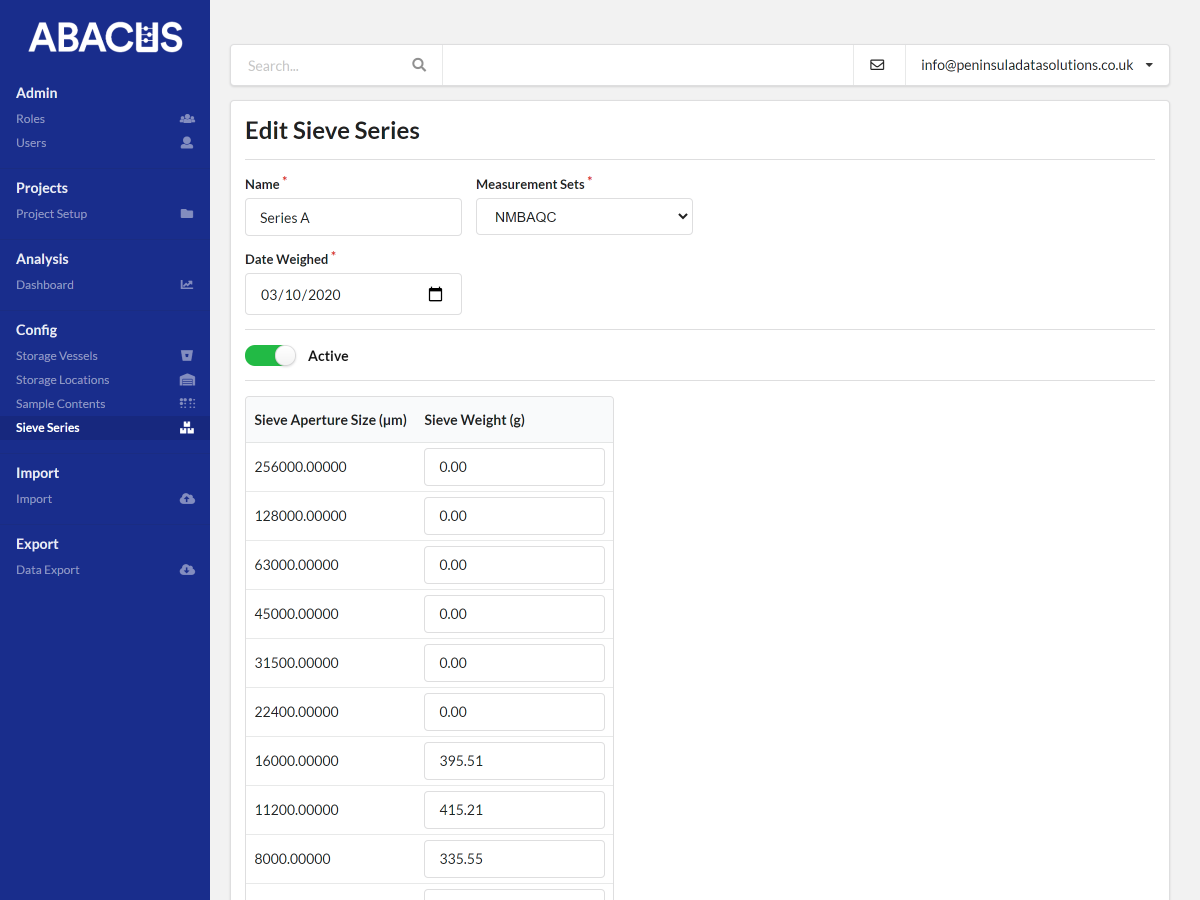
Sieve Series are set up in the Config section of ABACUS and store the weights of empty sieves that are used in Particle Size Analysis. These empty sieve weights are then used in the calculations of fraction weights during dry sieve analysis.
Organisation's can create as many sieve series as they need and can then remove them if they are replaced or no longer used.
Record sample metadata, sieve series and update the method
LICENSE NOT FOUND OR INVALID
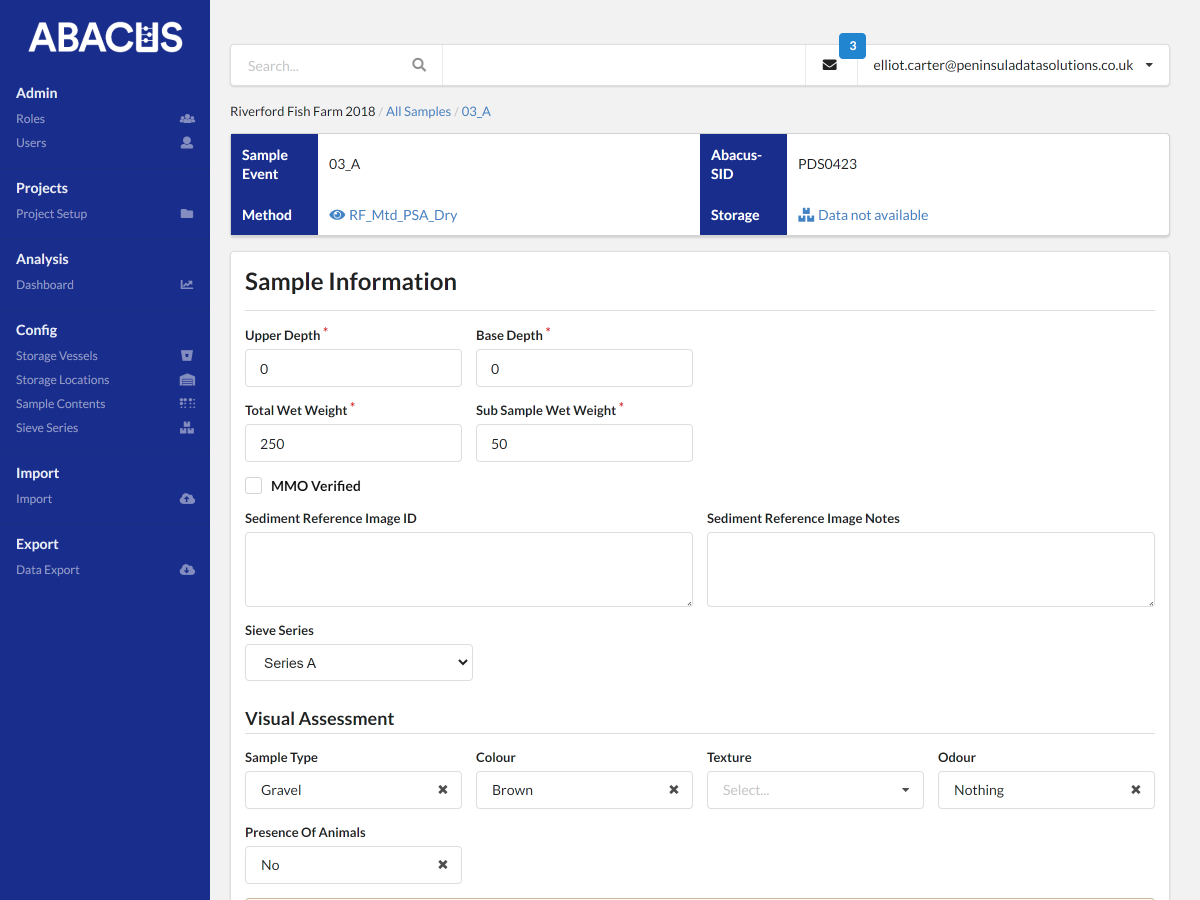
As well as Sample Metadata and Visual Assessment, the Sieve Series is also set per sample during this task. This links the sample to a series of empty sieve weights which will then be used in subsequent steps to calculate the weights of each fraction. By allowing analysts to specify the Sieve Series used for each sample they analyse an organisation can effectively use multiple sets of sieves interchangeably or even change part way through a survey without any complication or negative effect on the data recorded so far.
This page can also be used to change the method of analysis. For instance, all sample events could be created specifying that they require Dry & Laser analysis, but if on initial assessment an analyst feels that only Dry analysis is needed, this can be changed at this point.
Up-to-date and instant calculation results
LICENSE NOT FOUND OR INVALID
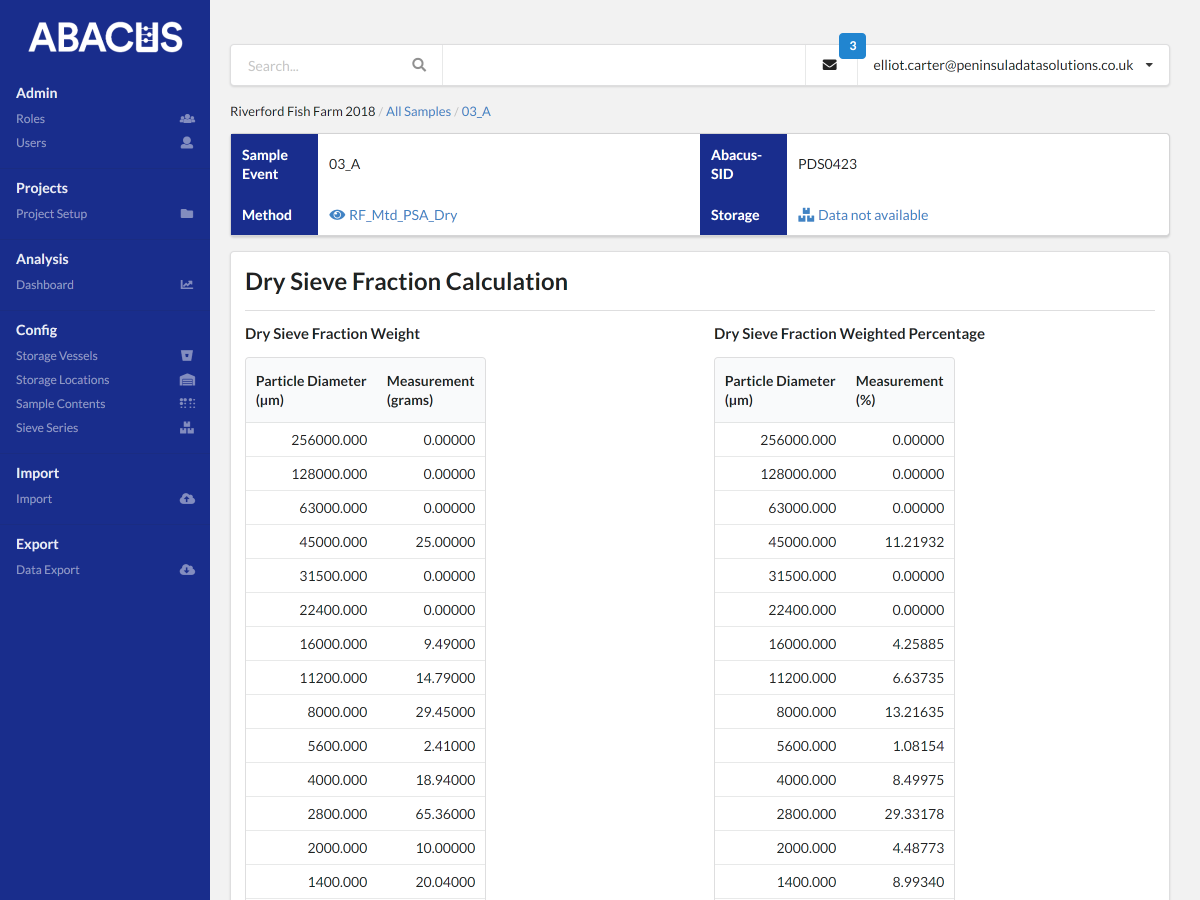
Detailed pages are available to see results of all calculations made during all steps of the PSA workflow. These are useful as a review stage and also help users to identify and address any mistakes at the point of data entry.
The screenshot shows the fraction weight, calculated as the raw sieve weight (entered earlier during the PSA workflow) minus the empty sieve weight (from the Sieve Series). Once the fraction weight is known, the weighted percentage is calculated as percentage of the total weight.
Key information displayed where you need it
LICENSE NOT FOUND OR INVALID
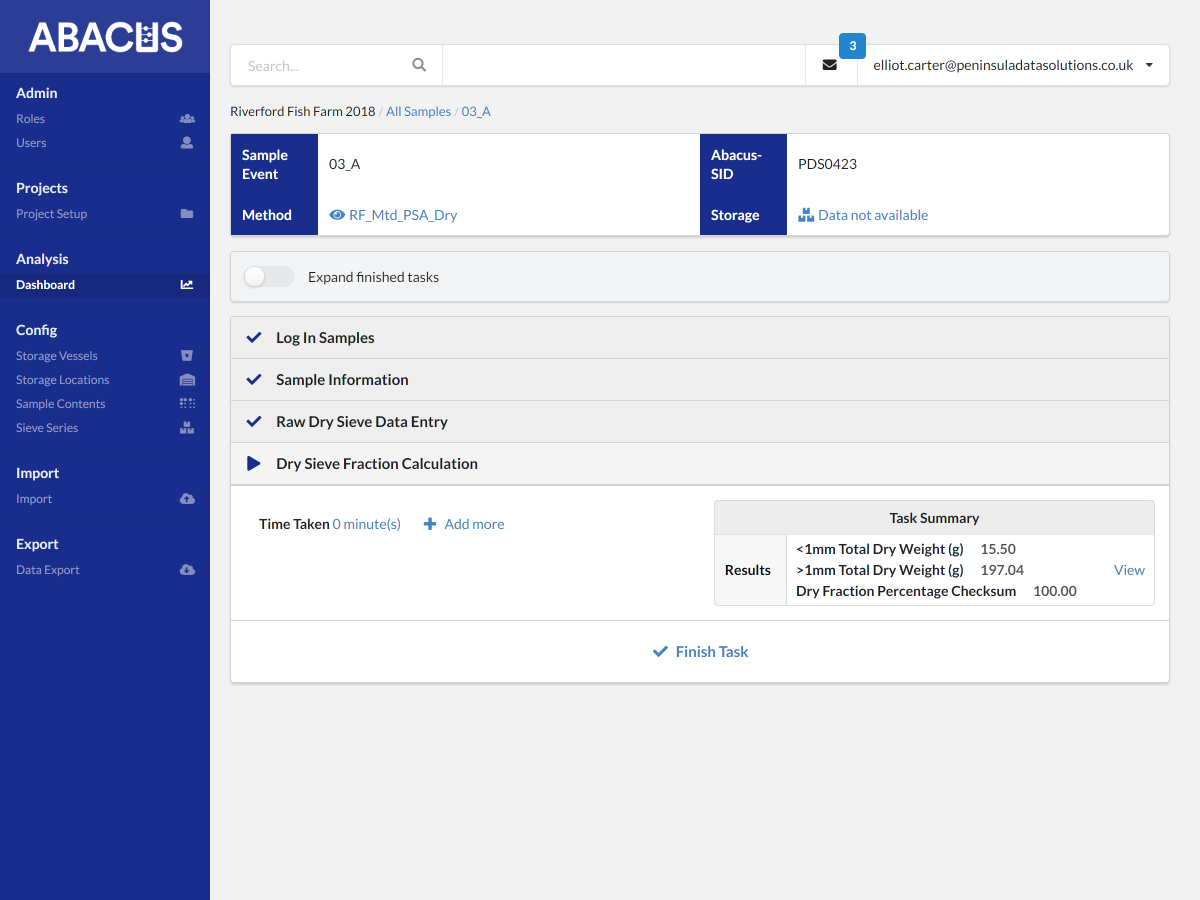
Relevant summary information and results are shown on the task list page for each sample so there is no need to digging through multiple pages of source data and calculations. This includes total weights and checksum values to immediately indicate any mistakes or concerns in the data.
A final output section is currently being developed for this page that will also show common metrics such as Gravel, Sand and Mud percentages and Folk Class.
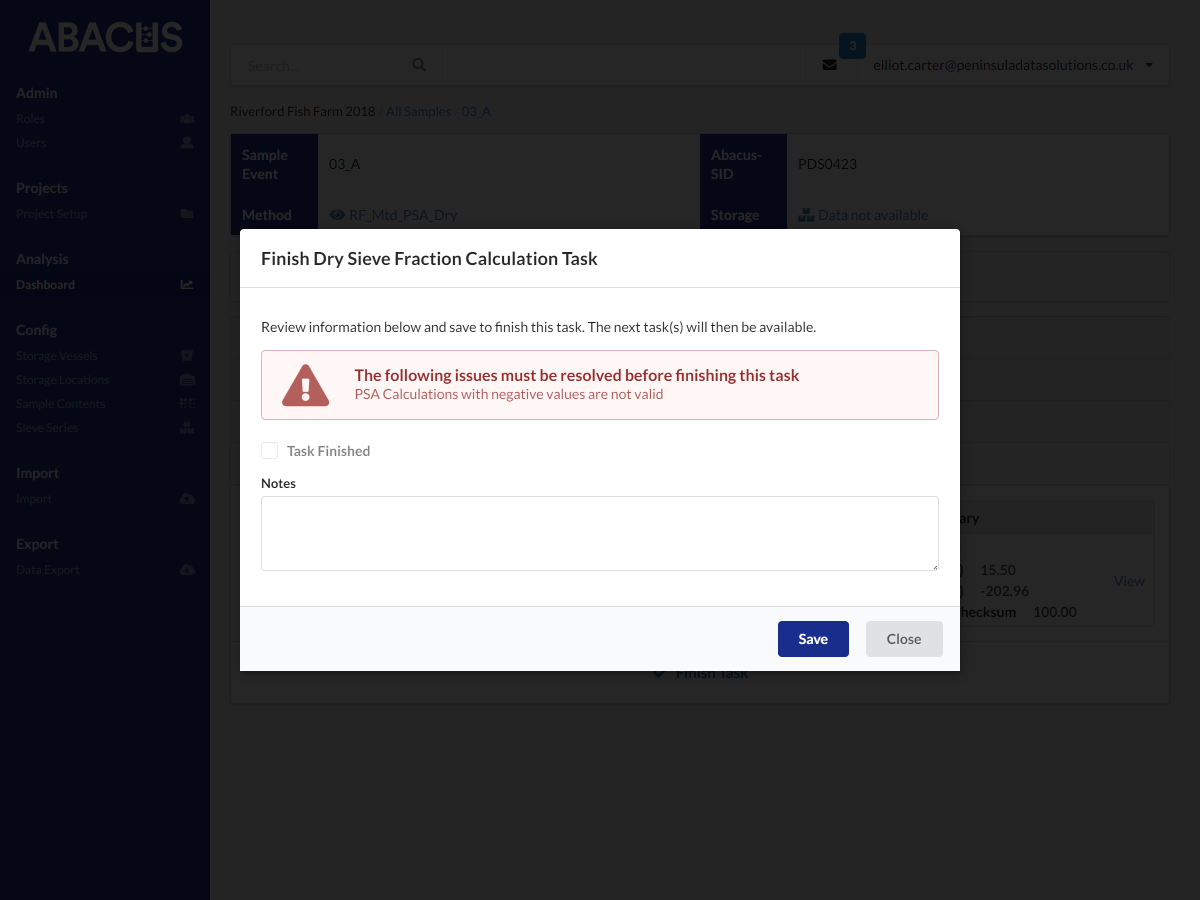
Mistakes identified and fixed at point of entry
LICENSE NOT FOUND OR INVALID
Data is checked for quality and common mistakes at the point an analyst attempts to mark a task as complete. If there any issues the task cannot be completed (but notes can still be saved).
In the screenshot, the task cannot be completed because a calculation has resulted in a negative value, which is not allowed. Viewing the Calculation Results page will show the negative value, which in this case was a typo in the data entry of a raw sieve weight.

Showcase video of Laser analysis data entry and export
LICENSE NOT FOUND OR INVALID
This video shows the full process of recording and exporting PSA data in ABACUS from creating a sample event, entering data and eventually exporting it. *This video covers the NMBAQC Laser Only analysis type.
At 01:50 in the video you can see how ABACUS allows users to quickly copy data from Excel into the web page to quickly enter data and avoid error-prone transcription. This feature is especially useful if source data of a laser diffraction machine is produced as an Excel or .csv file.
At 02:40 in the video the user is visually checking the results of the calculations performed on the entered data and the total sum (Checksum) is shown to equal 100 (%) as expected.
At 03:15 in the video shows the data export feature allowing users to quickly produce custom exports including subsets of analysis types, surveys, stations and samples.